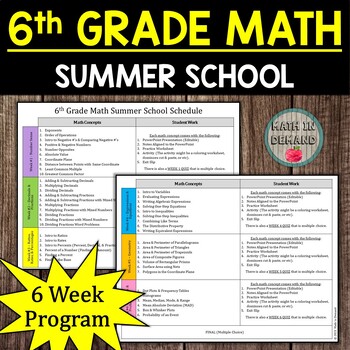
This is a listing for online access to my 6th Grade Math Summer School 6 Week Program.

The six-week program contains the following:
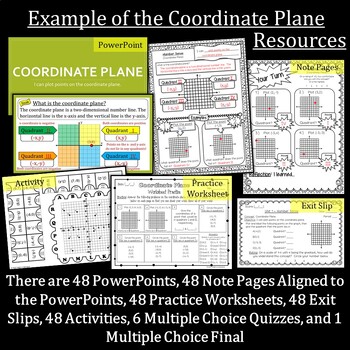
- 48 Editable PowerPoints that are ready to go with animations
- 48 Note Pages that are aligned to the PowerPoints
- 48 Activities (Varies from color by number, cut & paste, etc)
- 48 Practice Worksheets that have bubble-in answers for self-assessment
- 48 Exit Slips
- 6 Multiple Choice Quizzes
- 1 Multiple Choice Final
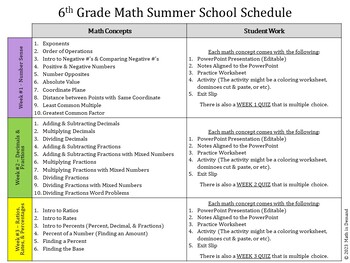
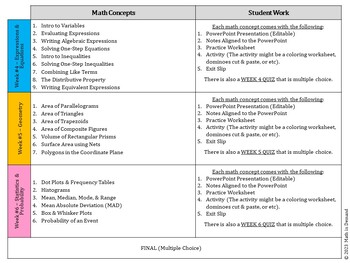
In other words, every math concept will include a PowerPoint, note page, activity, practice worksheet, and exit slip. There is a quiz for each week.

The 6 Week Program is broken down in the following way:
Week 1 - Number Sense
- Exponents
- Order of Operations
- Into Negative Numbers and Comparing Negative Numbers
- Positive and Negative Numbers
- Number Opposites
- Absolute Value
- Coordinate Plane
- Distance between Points with a Same Coordinate
- Least Common Multiple
- Greatest Common Factor
Week 2 - Decimals & Fractions
- Adding & Subtracting Decimals
- Multiplying Decimals
- Dividing Decimals
- Adding & Subtracting Fractions
- Adding & Subtracting Fractions with Mixed Numbers
- Multiplying Fractions
- Multiplying Fractions with Mixed Numbers
- Dividing Fractions
- Dividing Fractions with Mixed Numbers
- Dividing Fractions Word Problems
Week 3 - Ratios, Rates, & Percentages
- Intro to Ratios
- Intro to Rates
- Intro to Percents (Percents, Decimals, & Fractions)
- Percent of a Number (Finding an Amount)
- Finding a Percent
- Finding the Base
Week 4 - Expressions & Equations
- Intro to Variables
- Evaluating Expressions
- Writing Algebraic Expressions
- Solving One-Step Equations
- Intro to Inequalities
- Solving One-Step Inequalities
- Combining Like Terms
- The Distributive Property
- Writing Equivalent Expressions
Week 5 - Geometry
- Area of Parallelograms
- Area of Triangles
- Area of Trapezoids
- Area of Composite Figures
- Volume of Rectangular Prisms
- Surface Area using Nets
- Polygons in the Coordinate Plane
Week 6 - Statistics & Probability
- Dot Plots & Frequency Tables
- Histograms
- Mean, Median, Mode, & Range
- Mean Absolute Deviation (MAD)
- Box & Whisker Plots
- Probability of an Event

After purchase, you will gain access to my own website by emailing me your purchase ID #. You will be able to access all of the resources in an organized table.
CLICK HERE, to purchase!
Comments
Post a Comment